Somerville Condo Trends – September 2013

Somerville Condo Trends - 9-13
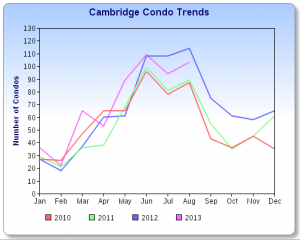
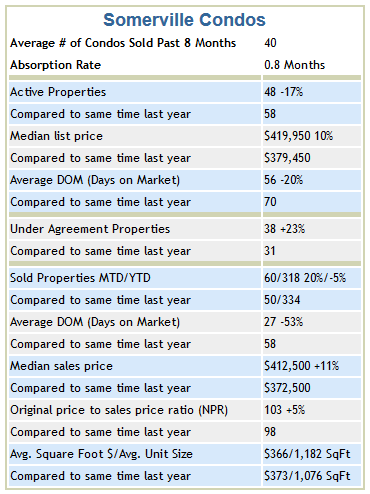
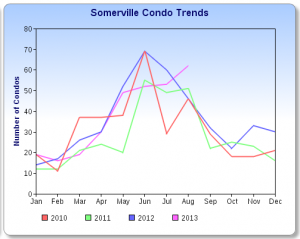
Somerville Summary: September condo inventory remains lower than last year by 17%. ~ Listing market $ value went up 6% from $22 million in 2012 to $23 million. ~ The median list price rose significantly by 34% with the active days on market the same at 51 days on average. ~ Condos going under agreement were up 24% compared to a year ago.

Somerville Condo Sales Chart 9-13

The number of condos sold in September was up 17% from a year ago resulting in a 2% loss in year to date sales. ~ Somerville sold condo market $ value YTD was up 7% to $160 million from $149 million in 2012. ~ The median sales price rose 6%. ~ Days on market were just over a month on average. The original price to sale price ratio was closer to normal at 98% of original list price. ~ The average square foot price of $377 was down 4% per square foot with the living area about 170 SF larger.


Top 5 Mistakes Home Buyers Make — and How to Avoid Them

By Brendon DeSimone | Zillow – Tue, Oct 1, 2013 3:53 PM EDT

From the beginning of your home search through closing escrow, there’s an awful lot to think about and do. It’s not unusual to make a mistake along the way. But with the financial stakes so high, a false move can end up costing you a lot of money.

Here are five common home buyer mistakes, with tips on how to avoid them.

You expect to get the price down after making an offer

The real estate market is heating up across the country. In many markets, homes are selling for more than asking price. Some buyers win the bidding war by going over asking — only to try to negotiate the price down by asking for credits during escrow.

This strategy may work sometimes, especially in a weak seller’s market. But we’re in a competitive market for buyers now, so don’t count on it. The seller most likely will have a backup offer from another buyer who really wants the home — and who is hoping your deal falls through. If you start asking for unwarranted credits, the seller may simply go with the backup offer, leaving you out in the cold.

A better strategy: Make your best offer, and don’t assume you can negotiate it down later.

You wait until the eleventh hour to ask for credits

In Houston, a seller had put his house on the market with full disclosure that it had termites. A buyer made an offer and went into contract with the seller. After further inspections, and at the eleventh hour, the buyer demanded an unreasonable amount be deducted from the sale price. The buyer assumed that the seller, not wanting to put the house on the market again, would agree, just to close the deal. But that’s not what happened. The seller agreed to reduce the price, but not by the full amount the buyer wanted.

The buyer ended up walking away from the deal. The house sold soon after at a higher price than what was negotiated with the first buyer.

Of course, you should ask for credits if an inspection turns up potentially costly repair work you didn’t know about when you made your offer. But even in a buyer’s market, don’t assume you can get sellers to cave in to unreasonable demands at the last minute.

[Thinking about getting a mortgage? Click to compare interest rates from multiple lenders now.]

You chase a deal at all costs

Everyone wants to save money, especially on a high-ticket item such as real estate. Unfortunately, this causes some would-be buyers to make lowball offers in hopes of getting a “deal.” Or, potential buyers lose out on homes they might have been able to get otherwise, which ends up costing money in the long run.

For example, a renter in San Francisco spent three years looking for the best “deal” she could possibly get, passing up many good opportunities. Eventually, her landlord wanted to sell the place she was renting. This forced her to finally buy, but under pressure. She ended up buying at the top of the market. If she hadn’t held out for so long in hopes of scoring an amazing deal, she’d have saved herself a lot of money and time. She’d even have built up some equity in a home over those three years.

In a strong real estate market, the deals are in homes that have been overpriced and haven’t sold as a result, and/or properties that don’t show well because they need work. If the home you want is well-priced, in a good neighborhood and doesn’t need much work, the best strategy is to make a solid offer and be prepared to go over asking if necessary.

You think you can do it all yourself

With so much information about homes available online today, many people, such as tech-savvy Gen X and Gen Y home buyers, may assume they can buy a home without a real estate agent’s help.

But this strategy often backfires. First of all, the real estate agent’s role isn’t just about finding listings. With Internet access, buyers can easily find listings themselves. The agent’s role today is more about presenting your offer to the seller’s agent in a way that will help get it accepted and making sure it sticks through an escrow.

A savvy agent knows the ins and outs of the local market better than an uninformed buyer with a full-time job and family. A good agent will know the back-stories behind the comps, for example. He or she will know that a comparable home sold for 5 percent less (than the home you’re considering) only because the sellers were divorcing, or the property had a retaining wall problem. Without an agent, you’d simply see that the comparable home sold for 5 percent less. You might ask the seller of the home to match that 5 percent reduction — and you’d be surprised when the seller says, “No thanks.”

Also, experienced agents have a strong network in the local market, which can give you an added edge. Good agents like to work with other good agents. And if nothing else, keep in mind that a listing agent might not even consider working with an unrepresented buyer.

Finally, the seller pays the buyer’s real estate commission, so having an agent for your home search costs you nothing anyway. Most importantly, there’s bound to come a time during the complicated real estate transaction when you have serious doubts or big questions. Your agent can be the trusted adviser you need to walk you through the maze.

[Click to shop around for mortgage interest rates and compare lenders now.]

You don’t think like a seller

Most likely, at some point in the future you’ll need to sell the home you’re about to buy. That’s why it’s important to think like a potential seller as well as a buyer.

Case in point: In 2005, a buyer in San Francisco bought a home with no garage. The house was on multiple transit lines, he used his bicycle to get around and he knew he’d have access to a leased garage space if he needed it. So he felt he didn’t need a garage.

Three years later, the market was slower, but the owner had to sell. He didn’t feel his home should be priced less than a comparable property with a deeded garage because his house was so centrally located. Plus, he had that leased garage space to offer. The problem was, many buyers drive to work, and they don’t want to risk losing a leased garage space. The result was that many buyers wouldn’t even look at his home’s photos online, let alone go to the open house — because it lacked a garage.

So when you’re buying a home, put yourself in a potential seller’s shoes. The last thing you want is to buy a dream home that becomes a nightmare when it’s time to sell.


Paul’s Condo Trends Cambridge – August 2013

Cambridge Condo Trends 9/13Cambridge Summary: Inventory continues to be a problem for buyers, down 48% from a year ago. ~ Condo $ market inventory value was down 45% from $67 million in August 2012 to $36 million.~ The median list price went up 10% with days on market at two months before going off market. Properties going under agreement fell by 41%.~

Cambridge Condo Sales Chart 8/13

Cambridge condo sales, month to date were down 18% with the year to date up a modest 6%. Sold market dollar volume YTD was up 24% from $278 million to $345 million in sales. The median sale price rose18% compared to a year ago. ~ Multiple offers and quick sales kept the original price to sale price at 103%. ~ The average square foot price was up 12% to $540.

Paul’s Somerville Condo Trends – August 2013

Somerville Condo TrendsSomerville Summary: August condo inventory remains low, down 17% from a year ago. ~ Listing market $ value was down 13% from $25 million in 2012 to $22 million. ~ The median list price rose 10% with the active days on market at 56 days on average. ~ Condos going under agreement were up 23% compared to a year ago.

Somerville Sales Chart 9/13

The number of condos sold in August were up 20% from a year ago resulting in a 5% loss in year to date sales. ~ Somerville sold condo market $ value YTD was up 4% to $140 million from $134 million in 2012. ~ The median sales price rose 11%. ~ Days on market remained less than a month on average. The original price to sale price ratio was 103% of original list price due to competitive bidding. ~ The average square foot price of $366 was down 2% per square foot with the living area about the same.


Paul’s Cambridge Condo Trends – July 2013

Cambridge July Condo Trends 2013

Cambridge Summary: Inventory continues to be a problem for buyers, down 57% from a year ago. ~Condo market inventory value was down 51% From 85 million in July 2012 to 41 million.~ The median list price was unchanged with days on market remaining below two months before going off market. Properties when U/A 37% faster than last year.~ Condos that went under agreement for the month were down 24%.

Cambridge Condo Sales Chart July 2013

Cambridge condo sales, month to date were d own 19% with the year to date up close to 10%. Sold market dollar volume YTD was up by 26% from 223 million to 281 million in sales. The median sale price rose15% compared to a year ago. ~ Multiple offers and quick sales kept the original price to sale price at 104%. ~ The average square foot price was $503.

Paul’s Somerville Condo Trends – July 2013

Somerville Condo Trends

Somerville Summary: July condo inventory remains low down 15% from a year ago. ~ Listing market value remained about the same with only a 1.3% increase in the 27 million range of value. ~ The median list price rose 14% with the active days on market just over one month, 24 days less on average. ~ Condos going under agreement were flat  increasing by only one compared to a year ago.

Somerville Condo Sales Chart July 2013


The number of condos sold in July also dropped by a third from a year ago, which resulted in a 12% loss in year to date sales. ~ Somerville sold condo market value YTD was down 0.66% to 113,985 million from 114,750 million in 2012. ~ The median sales price was about the same. ~ Days on market dropped to 14 days in July on average YTD. The original price to sale price ratio was 104% of original list price due to competitive bidding. ~ The average square foot price of $368 was up 3% per square foot with the living area increasing less than 5%.

July Market Update

2012/2013

MLS Summary:                              Inventory                Under Agreement      Year to Date Sold 2012/13
Cambridge Market:                       167/92= (-45%)      116/84 = (-27%)          562/624 = 11%

Somerville Market:                        114/90= (-21%)        69/74 = 7%                 425/379 = (-11%)

RE/MAX Destiny Closed Sides for July: 84            Volume: $64,679,397

Year to Date Transactions 299                                Volume: $175,407,720


Paul’s Mid-Year Condo Trends – Cambridge

Cambridge Condo Trends

Cambridge Summary: Inventory is extremely limited down 65% from a year ago.A huge challenge for buyers concerned about a recent rise in mortgage rates. ~ Condo market inventory value was down 52% From 95 million in June 2012 to 44 million at the end of last month ~ The median list price jumped up 32% with days on market remaining below two months before going off market. ~ Condos that went under agreement for the month were up slightly by nearly 2%.

Cambridge Condo Sales Chart

Cambridge condo sales, month to date were down 6% with the year to date up 17%. Sold market dollar volume YTD was up by 36% from 168 million to 228 million in sales. The median sale price rose nearly 15%. ~ Multiple offers and quick sales kept the original price to sale price to over 103%. ~ The average square foot price of $538 was up nearly 15%. Average living area also increased by nearly 5%.

Paul’s Mid-Year Condo Trends – Somerville

Somerville Condo Trends 6/30

Somerville Summary: June condo inventory remains at record lows, down 41% from a year ago. ~ Listing market value was down by 37% from 39 million to 25 million in value. ~ The median list price rose over 8% with the active days on market just over one month. ~ Condos going under agreement slipped by 15% from a year ago.

Somerville Condo Sales Chart

The number of condos sold in June also dropped by a third from a year ago, which resulted in a 12% loss in year to date sales. ~ Somerville sold condo market value YTD went down by 2% to 87 million from 89 million in 2012. ~ The median sales price was up 8% YTD. ~ Days on market decreased to 27 days in June 47 days on average YTD. The original price to sale price ratio was 102% of original list price due to competitive bidding. ~ The average square foot price of $383 was up 6% per square foot with the living area increasing less than 12%.


Cambridge Condo Trends – May 2013

Cambridge Condo Trends may 2013

Cambridge Summary: There were 23% more sales vs. properties for sale in May.  The lack of inventory continues as a huge challenge for buyers with inventory lower than last year by 56%. ~ Condo market inventory value was down 43% to $55 million vs. 96 million at the end of May last year. ~ The median list price remained unchanged with days on market shrinking to 45 days before going off market. ~ Condos that went under agreement for the month are up 40%.

Cambridge Condo Sales Chart May 2013

Cambridge condo sales, month to date, are up 48% with the year to date up 28%. Sold market dollar volume YTD was up by 46% from 111 million to 163 million in sales. The median sale price rose nearly 10%. ~ Multiple offers and quick sales put the original price to sale price to over 103%. ~ The average square foot price of $531 per square foot was up nearly 15%. Living area also increased by nearly 14%.