Cambridge Condo Trends – October 2013

Cambridge Condo Trends 10-13 
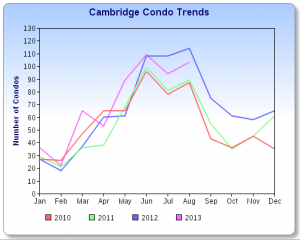
Cambridge Summary: Inventory has gone from little to less, down 62% from a year ago. ~ The median list price jumped 37 with days on market being just about two months before going off market. Properties going under agreement remains down by 26%.

Cambridge Condo Sales Chart

Cambridge condo sales, month to date were down 20% with the year to date losing two points, up 4% over last year’s number. The median sale price was up almost 19%.. ~ Multiple offers and quick sales kept the original price to sale price higher than normal at 103%. ~ The average square foot price was $523 per SF with an average condo size of 1.158 SF.

Somerville Condo Trends – October 2013

Somerville Condo Trends October 2013Somerville Summary: October condo inventory is about the same as last year. ~ The median list price rose significantly by 51% with the active days on market slightly higher at 62 days on average. ~ Condos going under agreement were up 15% compared to a year ago.

Somerville Condo Sales Chart 10-13


The number of condos sold in September was up 8% from a year ago resulting in a negligible loss of 0.3% in year to date sales. ~ The median sales price rose 15%. ~ Days on market were just two months on average. The original price to sale price ratio was 104% of the original list price. ~ The average square foot price was up nearly $50.00 at $399 with the living area 132 SF larger.

Cambridge Condo Trends – September 2013

Paul's Cambridge Condo Trends 9-13Cambridge Summary: Inventory continues to be a major problem for buyers, down 55% from a year ago. ~ Condo $ market inventory value was down 39% from $62 million last September 2012 to $38 million.~ The median list price went up 22% with days on market just under two months before going off market. Properties going under agreement is down by 26%.

Cambridge Condo Sales Chart 9-13

Cambridge condo sales, month to date were down 9% with the year to date remaining up 6%. Sold market dollar volume YTD remains at 24% from $318 million to $394 million in sales. The median sale price rose 20% compared to a year ago. ~ Multiple offers and quick sales kept the original price to sale price higher than normal at 99%. ~ The average square foot price was up 14% at $556 per SF.


Somerville Condo Trends – September 2013

Somerville Condo Trends - 9-13Somerville Summary: September condo inventory remains lower than last year by 17%. ~ Listing market $ value went up 6% from $22 million in 2012 to $23 million. ~ The median list price rose significantly by 34% with the active days on market the same at 51 days on average. ~ Condos going under agreement were up 24% compared to a year ago.

Somerville Condo Sales Chart 9-13

The number of condos sold in September was up 17% from a year ago resulting in a 2% loss in year to date sales. ~ Somerville sold condo market $ value YTD was up 7% to $160 million from $149 million in 2012. ~ The median sales price rose 6%. ~ Days on market were just over a month on average. The original price to sale price ratio was closer to normal at 98% of original list price. ~ The average square foot price of $377 was down 4% per square foot with the living area about 170 SF larger.


Paul’s Condo Trends Cambridge – August 2013

Cambridge Condo Trends 9/13Cambridge Summary: Inventory continues to be a problem for buyers, down 48% from a year ago. ~ Condo $ market inventory value was down 45% from $67 million in August 2012 to $36 million.~ The median list price went up 10% with days on market at two months before going off market. Properties going under agreement fell by 41%.~

Cambridge Condo Sales Chart 8/13

Cambridge condo sales, month to date were down 18% with the year to date up a modest 6%. Sold market dollar volume YTD was up 24% from $278 million to $345 million in sales. The median sale price rose18% compared to a year ago. ~ Multiple offers and quick sales kept the original price to sale price at 103%. ~ The average square foot price was up 12% to $540.

Paul’s Somerville Condo Trends – August 2013

Somerville Condo TrendsSomerville Summary: August condo inventory remains low, down 17% from a year ago. ~ Listing market $ value was down 13% from $25 million in 2012 to $22 million. ~ The median list price rose 10% with the active days on market at 56 days on average. ~ Condos going under agreement were up 23% compared to a year ago.

Somerville Sales Chart 9/13

The number of condos sold in August were up 20% from a year ago resulting in a 5% loss in year to date sales. ~ Somerville sold condo market $ value YTD was up 4% to $140 million from $134 million in 2012. ~ The median sales price rose 11%. ~ Days on market remained less than a month on average. The original price to sale price ratio was 103% of original list price due to competitive bidding. ~ The average square foot price of $366 was down 2% per square foot with the living area about the same.


Paul’s Cambridge Condo Trends – July 2013

Cambridge July Condo Trends 2013

Cambridge Summary: Inventory continues to be a problem for buyers, down 57% from a year ago. ~Condo market inventory value was down 51% From 85 million in July 2012 to 41 million.~ The median list price was unchanged with days on market remaining below two months before going off market. Properties when U/A 37% faster than last year.~ Condos that went under agreement for the month were down 24%.

Cambridge Condo Sales Chart July 2013

Cambridge condo sales, month to date were d own 19% with the year to date up close to 10%. Sold market dollar volume YTD was up by 26% from 223 million to 281 million in sales. The median sale price rose15% compared to a year ago. ~ Multiple offers and quick sales kept the original price to sale price at 104%. ~ The average square foot price was $503.

Paul’s Somerville Condo Trends – July 2013

Somerville Condo Trends

Somerville Summary: July condo inventory remains low down 15% from a year ago. ~ Listing market value remained about the same with only a 1.3% increase in the 27 million range of value. ~ The median list price rose 14% with the active days on market just over one month, 24 days less on average. ~ Condos going under agreement were flatĀ  increasing by only one compared to a year ago.

Somerville Condo Sales Chart July 2013


The number of condos sold in July also dropped by a third from a year ago, which resulted in a 12% loss in year to date sales. ~ Somerville sold condo market value YTD was down 0.66% to 113,985 million from 114,750 million in 2012. ~ The median sales price was about the same. ~ Days on market dropped to 14 days in July on average YTD. The original price to sale price ratio was 104% of original list price due to competitive bidding. ~ The average square foot price of $368 was up 3% per square foot with the living area increasing less than 5%.

Paul’s Mid-Year Condo Trends – Cambridge

Cambridge Condo Trends

Cambridge Summary: Inventory is extremely limited down 65% from a year ago.A huge challenge for buyers concerned about a recent rise in mortgage rates. ~ Condo market inventory value was down 52% From 95 million in June 2012 to 44 million at the end of last month ~ The median list price jumped up 32% with days on market remaining below two months before going off market. ~ Condos that went under agreement for the month were up slightly by nearly 2%.

Cambridge Condo Sales Chart

Cambridge condo sales, month to date were down 6% with the year to date up 17%. Sold market dollar volume YTD was up by 36% from 168 million to 228 million in sales. The median sale price rose nearly 15%. ~ Multiple offers and quick sales kept the original price to sale price to over 103%. ~ The average square foot price of $538 was up nearly 15%. Average living area also increased by nearly 5%.

Paul’s Mid-Year Condo Trends – Somerville

Somerville Condo Trends 6/30

Somerville Summary: June condo inventory remains at record lows, down 41% from a year ago. ~ Listing market value was down by 37% from 39 million to 25 million in value. ~ The median list price rose over 8% with the active days on market just over one month. ~ Condos going under agreement slipped by 15% from a year ago.

Somerville Condo Sales Chart

The number of condos sold in June also dropped by a third from a year ago, which resulted in a 12% loss in year to date sales. ~ Somerville sold condo market value YTD went down by 2% to 87 million from 89 million in 2012. ~ The median sales price was up 8% YTD. ~ Days on market decreased to 27 days in June 47 days on average YTD. The original price to sale price ratio was 102% of original list price due to competitive bidding. ~ The average square foot price of $383 was up 6% per square foot with the living area increasing less than 12%.