Cambridge vs. Somerville

Happy New Year!
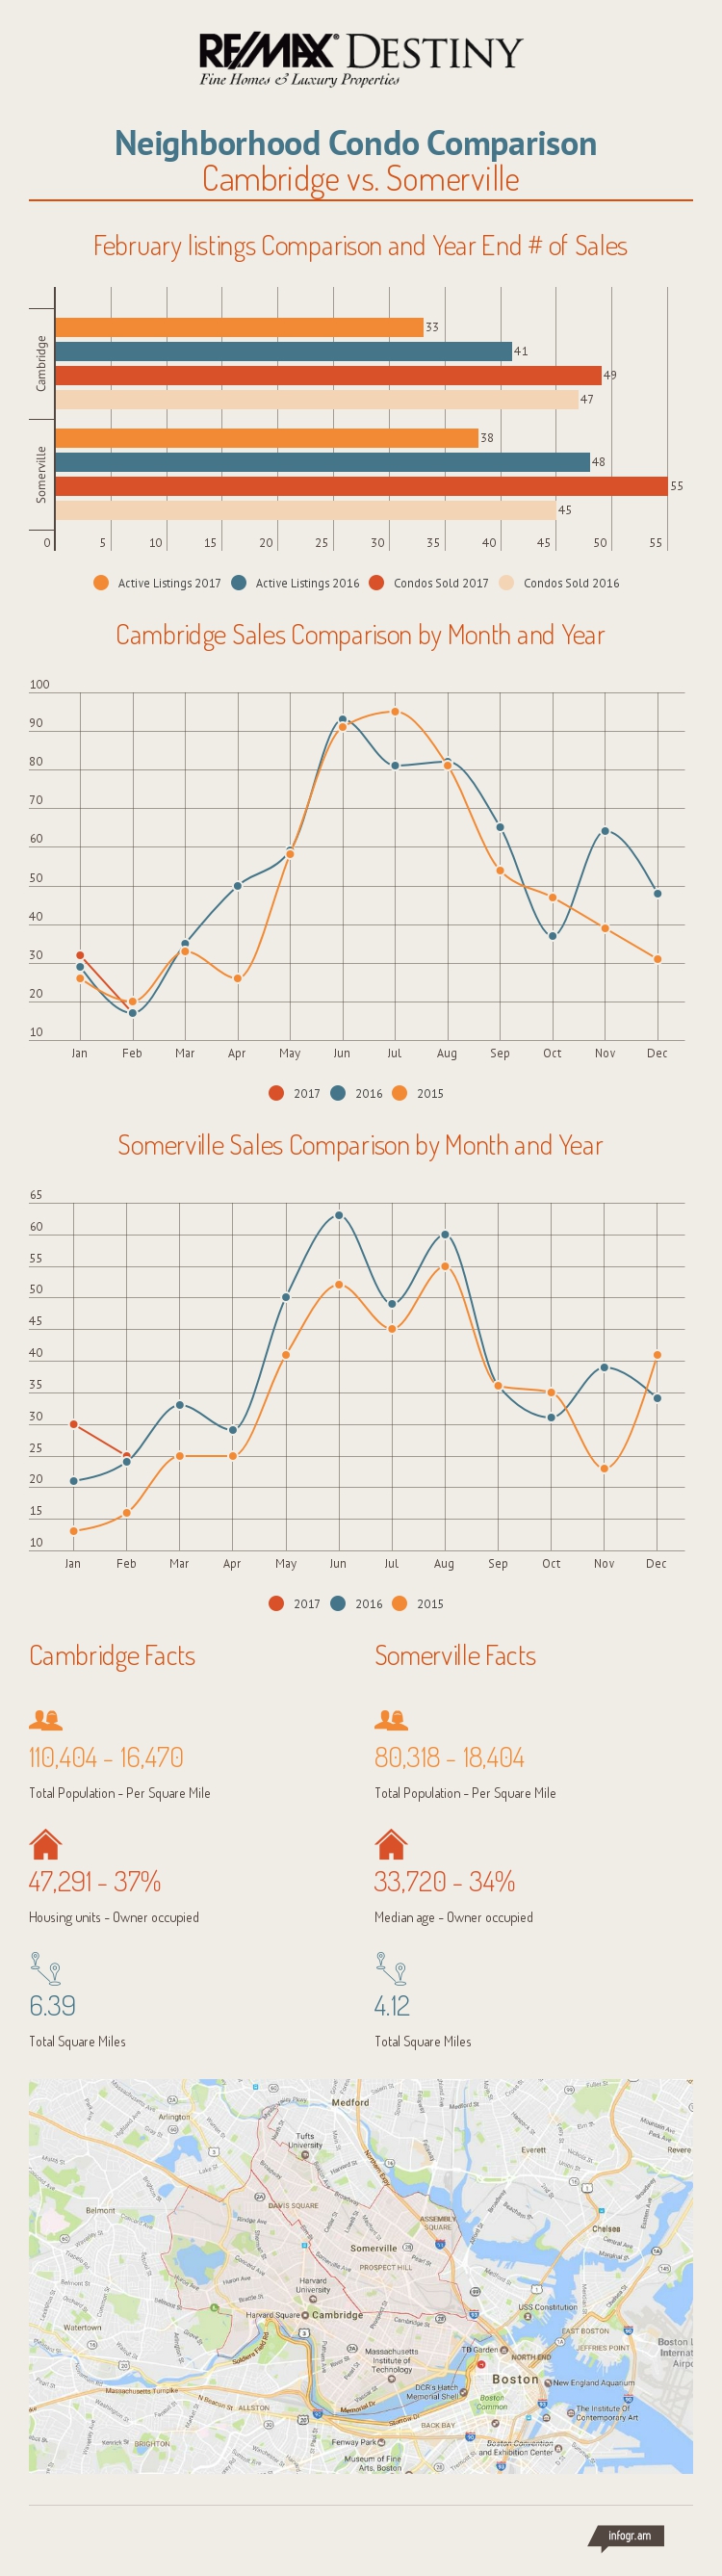
We’ve created this infographic that we will be using throughout the year to compare the condo market in Cambridge and Somerville. This will replace the condo trends we’ve sent out in the past. Let us know what you think.
Thanks.
Check out our new Neighborhood Condo Comparison infographic. We are ready for next year where we will be comparing the number of condos on the market year over year, looking at the year to date number of sales and more.
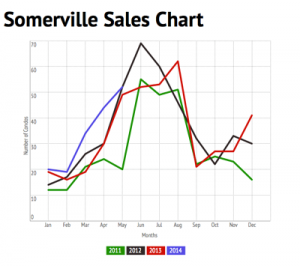
Below you will find neighborhood graphs showing: the number sales by month for the past three years, some interesting demographic tidbits and an area map. You can also check out other neighborhoods using Clickable Maps on DestinyAgents.com or sign up for our Market Reports to receive information on properties similar to yours and in your neighborhood that are currently on the market and those that have recently been sold. It’s a great way to get an idea of your homes appreciation. If you want to dive deeper into the details just let us know. We can help.
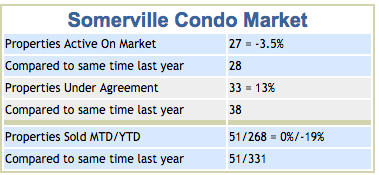
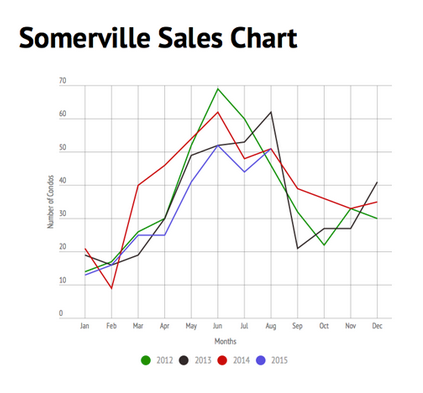
Somerville inventory was down 3.5% compared to August of last year. The number of condos that went “Under Agreement” remained in positive territory up 13%. Condo sales month to date were unchanged. Whereas sales year to date showed a negative 19% below August of last year. The average sales price increased by 10% to $516,018. The average sold square foot price went up $32 to $477 per square foot with an average unit size of 1,221 square feet.
By Paul Turcotte – Reports on other towns or property type and price ranges available on request.
Condominium sales rose in June with a total of 2,794 transactions completed compared with 2,429 in June 2014, a 15.0 percent increase. June marked the best month for condo sales since August 2007 and the first time in seven consecutive months that condo sales have increased on a year-over-year basis. Year-to-date sales of condos are down by 0.7 percent with 9,526 sales completed during the first six months of this year compared with 9,590 recorded during the same period last year. Read more from the Warren Group…Condos Sales Increase By 15.0 Percent…
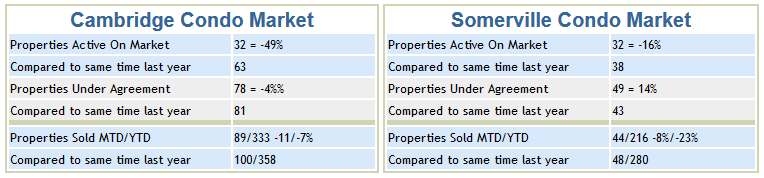
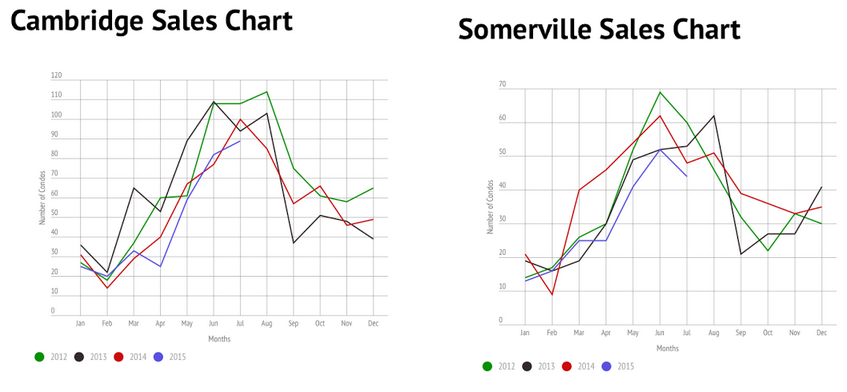
Cambridge condo inventory continues to frustrate buyers and their agents being down 32% from a year ago. Now for some acceptable news, the number of condominiums that went “Under Agreement” was only 4% below the end of July 2014. Condominiums sold last month were 11% less with year to date sales down 7%. The average sale price remained stable at $745,246. The average sold square foot price was up $24 to $675 per square foot with an average unit size of 1,129 square feet.
Cambridge Market Report – June 2015
Somerville inventory was down 16% compared to July of last year. The number of condos that went “Under Agreement” was in positive territory up 14%. Condo sales month to date still ran a negative 8% with sales year to date coming in at 23% below the same time last year. The average sales price declined from $604,000 in June to $582,249. The average sold square foot price went up slightly to $500 per square foot with an average unit size was 1,195 square feet.
See condo sales information in Warren Group article on Bay State Homes for May or review New England market activity New England Housing Report

Cambridge condo inventory continues to frustrate buyers and their agents being down 37% from a year ago. The number of condominiums that went “under agreement” improved although remaining off by 6% from the end of June 2014. Condominiums sold in June were 2.5% off with year to date sales remaining down by 8%. The average sale price continued to rise in June to $743 from $701 in May. The average sold square foot price was $651 per square foot with an average unit size of 1,161 square feet.
Cambridge Market Report -May 2015
Somerville inventory was down slightly by 6% or 2 units compared to June of last year. The number of condos going “under agreement” was down 15%, a considerable drop from the previous month. Condo sales month to date ran a negative 21% with sales year to date coming in at 27% below the same time last year. The average sales price declined from $656,000 in May to $604,000 in June. The average sold square foot price remained the same month over month at $483 per square foot. The average unit size was 1,302 square feet.
Somerville Market Report May 2015
 In Somerville, more than 90% of the May sales we tracked got at least asking price and 80% went over-ask. Unbelievable! A year ago, there were no Somerville condos that sold for more than $100,000 over-ask and only one sold for more than $50,000 over-ask. This May, however, two Somerville condos went for more than $100,000 over-ask and 11 garnered at least $50,000 over-ask. Somerville, on the other hand has a smaller condo market, however it is in positive territory in all three areas.
Since April 1, 25 condos have sold in the City of Seven Hills. Of that number, 15, or 60 percent, have sold above asking price, four sold at asking and the remaining six were sold below asking, according to a Boston Business Journal analysis of MLS Properties.
The median sales in Somerville increased 9% to $490,000.

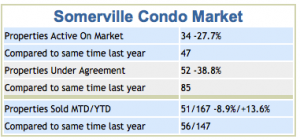
Somerville Summary: Somerville inventory is down 27%, nine properties from a year ago. On market listing value is down 28% or a bit over 4 million in value. Pending sales are up 16%.

The year to date sales dollar volume is up by 28%, which equates to just under 7 million over the first quarter of 2013. The average days on market was 64. The average condo was 1,289 square feet, which is relatively unchanged with an average sale price of $663,656 was up by $165,586 . The aveage price per square foot – $412.

Somerville Summary: December condo inventory was down more than 20% compared to last year. ~ The median list price leaped up by 63% with the active days on market shrinking by 15% or 14 days on average. ~ Condos going under agreement declined by 25% compared to last December.

The number of condos sold went up by 45% for the month which resulted in a gain of over 2% for the year. ~ The median sales price rose 33%. ~ Days on market for condo sales were just over a month on average. The original price to sale price ratio was 100% of the original list price. ~ The average square foot price jumped $106 to $441 per SF with an average living area just over 1,200 SF.
 Somerville Summary: October condo inventory is about the same as last year. ~ The median list price rose significantly by 51% with the active days on market slightly higher at 62 days on average. ~ Condos going under agreement were up 15% compared to a year ago.

The number of condos sold in September was up 8% from a year ago resulting in a negligible loss of 0.3% in year to date sales. ~ The median sales price rose 15%. ~ Days on market were just two months on average. The original price to sale price ratio was 104% of the original list price. ~ The average square foot price was up nearly $50.00 at $399 with the living area 132 SF larger.