712,000 Homes in the US Regained Equity in the Past 12 Months!

712,000 Homes in the US Regained Equity in the Past 12 Months! | Simplifying The Market

CoreLogic’s latest Equity Report revealed that “over the past 12 months, 712,000 borrowers moved into positive equity.” This is great news, as the share of homeowners with negative equity (those who owe more than their home is worth), has dropped more than 20% since the peak in Q4 of 2009 (26%) to 4.9% today.

The report also revealed:

  • The average homeowner gained approximately $14,900 in equity during the past year.
  • Compared to Q3 2016, negative equity decreased 22% from 3.2 million homes, or 6.3% of all mortgaged properties.
  • U.S. homeowners with mortgages (roughly 63% of all homeowners) have seen their equity increase by a total of $870.6 billion since Q3 2016, an increase of 11.8%, year-over-year.

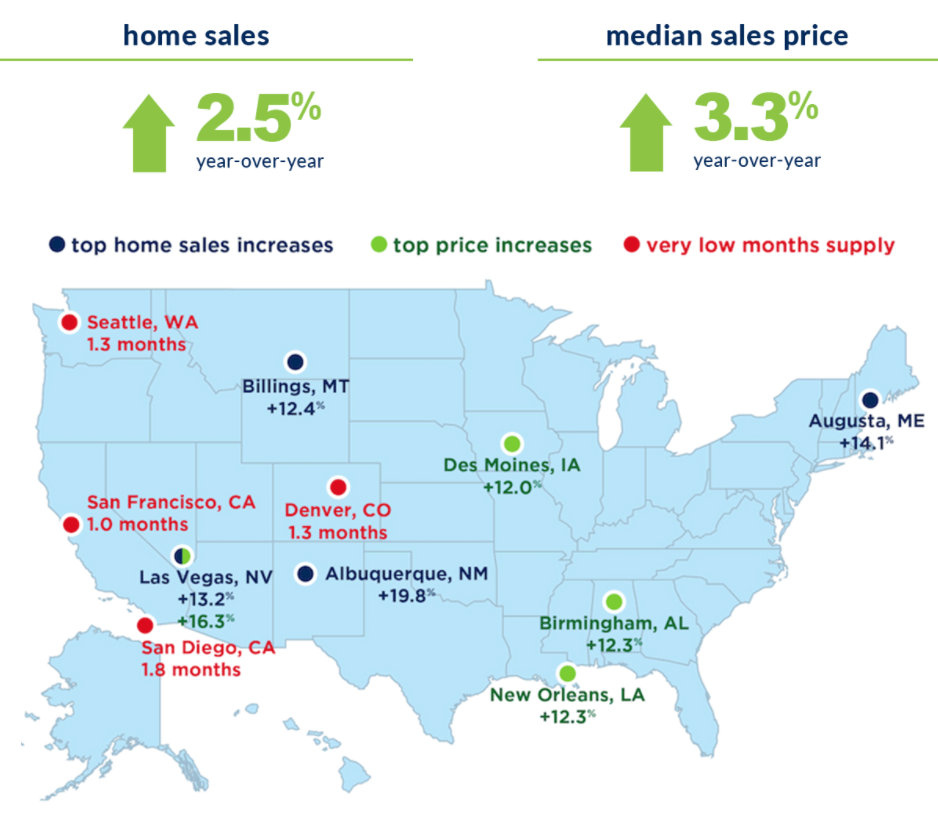
The map below shows the percentage of homes by state with a mortgage and positive equity. (The states in gray have insufficient data to report.)

712,000 Homes in the US Regained Equity in the Past 12 Months! | Simplifying The Market

Significant Equity Is on The Rise

Frank Nothaft, Chief Economist at CoreLogic, believes this is great news for the “housing market.” He went on to say:

“Homeowner equity increased by almost $871 billion over the last 12 months, the largest increase in more than three years. This increase is primarily a reflection of rising home prices, which drives up home values, leading to an increase in home equity positions and supporting consumer spending.”

Of the 95.1% of homeowners with positive equity in the U.S., 82.9% have significant equity (defined as more than 20%). This means that more than three out of four homeowners with a mortgage could use the equity in their current home to purchase a new home now.

The map below shows the percentage of homes by state with a mortgage and significant equity.

712,000 Homes in the US Regained Equity in the Past 12 Months! | Simplifying The Market

Bottom Line

If you are one of the many homeowners who are unsure of how much equity you have in your home and are curious about your ability to move, let’s meet up to evaluate your situation.

Source: Keep Current Matters Feed

4 Reasons to Sell This Winter [INFOGRAPHIC]

4 Reasons to Sell This Winter [INFOGRAPHIC] | Simplifying The Market

4 Reasons to Sell This Winter [INFOGRAPHIC] | Simplifying The Market


Some Highlights:

  • Buyer demand continues to outpace the supply of homes for sale which means that buyers are often competing with one another for the few listings that are available!
  • Housing inventory is still under the 6-month supply needed to sustain a normal housing market.
  • Perhaps the time has come for you and your family to move on and start living the life you desire.

Source: Keep Current Matters Feed

Time on the Market Drops to New Low in 2017

According to recently released data from the National Association of Realtors (NAR), the median amount of time a home spent on the market hit an all-time low of only three weeks in 2017.

Strong buyer demand, a good economy, and a low inventory of new and existing homes for sale created the perfect storm to accelerate the time between listing and signing a contract. The time needed to sell a home has dropped substantially since its highest mark of 11 weeks in 2012.

The chart below shows the median weeks on the market from 1987 to today.

Time on the Market Drops to New Low in 2017 | Simplifying The Market

Bottom Line

If you are a homeowner who is debating whether or not to list your home for sale, know that national market conditions are primed for a quick turnaround! Let’s get together to discuss exactly what’s going on in our area, today!

Source: Keep Current Matters Feed

The Benefits of Homeownership Go Beyond the Financial

The Benefits of Homeownership Go Beyond the Financial | Simplifying The Market

Homeownership is a major part of the American Dream. As evidence of that, 91% of Americans believe that owning a home is either essential (43%) or important (48%) to achieving that “dream.” In a market where some people may be unsure about the benefits and possibilities of buying a home, it is important that we remember this.

Homeownership is NOT just about the money. In fact, some of the major benefits are non-financial. Here are a few of those benefits as per the National Association of Realtors:

  • Consistent findings show that homeownership does make a significant positive impact on educational achievement.
  • Several researchers have found that homeowners tend to be more involved in their communities than renters.
  • Early studies of homeownership and health outcomes found that homeowners and children of homeowners are generally happier and healthier than non-owners, even after controlling for factors such as income and education levels that are also associated with positive health outcomes and positively correlated with homeownership.

Bottom Line

Homeownership means something more to people and their families than just the financial considerations.

Source: Keep Current Matters Feed

Neighborhood Condo Comparison – September 2017

Neighborhood Condo Comparison

Cambridge
September 2017: Condos sold: 39 = less 42% | Average SF: $727 = up 13%
Median Sale Price: $767,000 = up 16% | Sale price to original price: 103.9%

September 2016: Condos sold: 68 | Avg. SF: $699
Median Sale Price: $622,500| Sale price to original: 103.1%

Somerville
September 2017: Condos sold: 44 = up 22% | Average SF: $575 = up 13%
Median Sale Price: $630,000 = up 2% | Sale price to original: 102.4%

September 2016: Condos sold: 36 | Average SF: $509
Median Sale Price: $595,393 | Sale price to original: 102.4%


Jamaica Plain
September 2017: Condos sold: 21 = less 16% | Average SF: $477 = 4% increase
Median Sale Price: $450,000 = down 12% | Sale price to original price: 102.5%

September 2016: Condos sold: 68 | Avg. SF: $699
Median Sale Price: $622,500| Sale price to original: 104.2%

Roslindale
September 2017: Condos sold: 11 = less 15% | Average SF: $339 = 11% increase
Median Sale Price: $450,000 = up 10% | Sale price to original: 105.7%

September 2016: Condos sold: 36 | Average SF: $509
Median Sale Price: $595,393 | Sale price to original: 105.5%

Condo Comparison, June 2017

Overall estimates for residential appreciation in the Boston market over the last year is in the range of 11% and Zillow is conservatively predicting around 5% for the next year.  Is this growth sustainable?  Who knows?  What we do know is that the market is cyclical and that what goes up spirals around to a seemingly higher low than the last. Take a look at the graphs below.

Cambridge / Somerville Condo Market Comparison June 2017 vs. 2016

Cambridge:
June 2017: Condos sold: 81 = less14%  | Average. SF: $779 = 11% increase
Median Sale Price: $769,000 = up 7%  | Sale price to original price: 108%

June 2016: Condos sold: 94 | Avg. SF: $701
Median Sale Price: $716,950 | Sale price to original: 107.4%

Somerville:
June 2017: Condos sold: 53 = less18% | Avg. SF: $592 = 14% increase
Median Sale Price: $611,000 = up 2% | Sale price to original: 107.4%

June 2016: Condos sold: 65 | Avg. SF: $521
Median Sale Price: $600,000 | Sale price to original: 104.6%

Cambridge vs Somerville Condo Comparison


JP/ Roslindale Condo Market Comparison June 2017 vs. 2016

Jamaica Plain: 
June 2017: Condos sold: 59 = less 19%| Avg. SF: $503
Median Sale Price: $504,000 = up 3% | Sale price to original: 103.7%

June 2016: Condos sold: 73 | Avg. SF: $463 = 9% increase
Median Sale Price: $490,000 | Sale price to 0riginal: 106.1%

Roslindale:
June 2017: Condos sold: 21 = 5% increase | Avg. SF: $360 = 5% decrease
Median Sale Price: $455,000 = up 23% | Sale price to original: 105.7%

June 2016: Condos sold: 20 | Avg. SF: $378
Median Sale Price: $368,000 | Sale price to original: 103.3%


Condo Comparison May 2017

“BOSTON – The number of homes and condos sold in Greater Boston slipped a bit in April,” said Timothy Warren, CEO of The Warren Group. “But that is due to the fact that April last year was a gangbuster month with homes rocketing up 35.3 percent and condos gaining 18.7%. These benchmarks were too hard to match.”
Despite record-setting condo prices, sales dipped from April 2016 when there were 1,705 sold in April 2017 compared to 1,724 last year – a decline of 1.1 percent. Median condo prices rose by 3.4 percent, hitting $331,500 – the highest on record for April.  Warren Report, May 23, 2017.

Cambridge Condos End of May 2017 
Condos sold: 74 | Avg. SF: $764
Median Sale Price: $770,750 | Sale price to Original: 108.2%Cambridge Condos End of May 2016
Condos sold: 62 | Avg. SF: $756
Median Sale Price: $695,250 | Sale price to Original: 106.5%

Somerville Condos End of May 2017
Condos sold: 34 | Avg. SF: $565
Median Sale Price: $746,500 | Sale price to Original: 103.6%

Somerville Condos End of May 2016
Condos sold: 59 | Avg. SF: $593
Median Sale Price: $583,000 | Sale price to Original: 106.5%

JP Condos End of May 2017
Condos sold: 32 | Avg. SF: $509
Median Sale Price: $575,000 | Sale price to Original: 103.7%

JP Condos End of May 2016
Condos sold: 35 | Avg. SF: $499
Median Sale Price: $570,000 | Sale price to Original: 102.3%

Roslindale Condos End of May 2017
Condos sold: 9 | Avg. SF: $396
Median Sale Price: $450,000 | Sale price to Original: 110.4%

Roslindale Condos End of May 2016
Condos sold: 21 | Avg. SF: $366
Median Sale Price: $405,000 | Sale price to Original: 102.6%

All the best,
Paul