Cambridge Condo Trends – May 2013

Cambridge Condo Trends may 2013

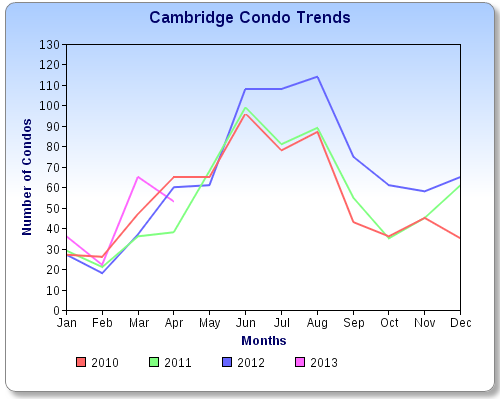
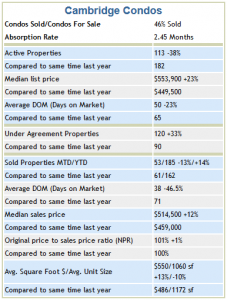
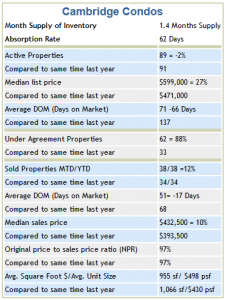
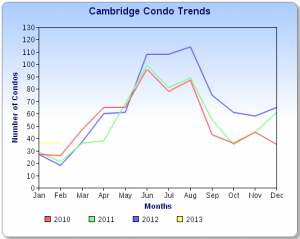
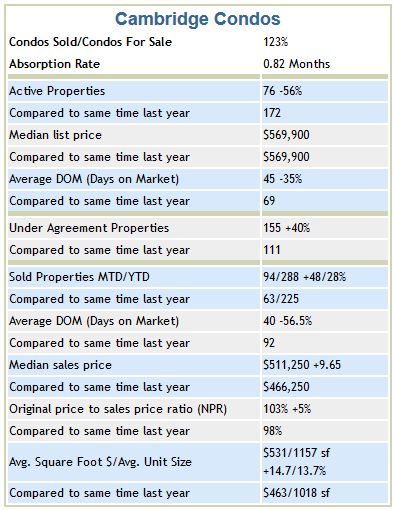
Cambridge Summary: There were 23% more sales vs. properties for sale in May.  The lack of inventory continues as a huge challenge for buyers with inventory lower than last year by 56%. ~ Condo market inventory value was down 43% to $55 million vs. 96 million at the end of May last year. ~ The median list price remained unchanged with days on market shrinking to 45 days before going off market. ~ Condos that went under agreement for the month are up 40%.

Cambridge Condo Sales Chart May 2013

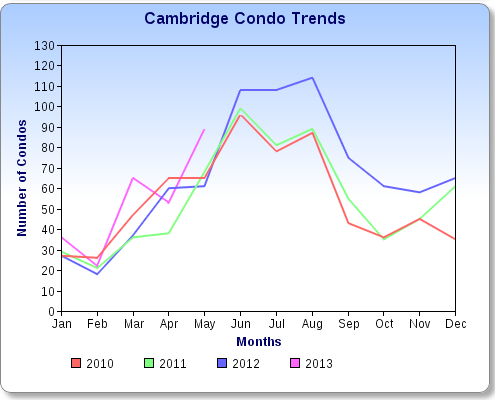
Cambridge condo sales, month to date, are up 48% with the year to date up 28%. Sold market dollar volume YTD was up by 46% from 111 million to 163 million in sales. The median sale price rose nearly 10%. ~ Multiple offers and quick sales put the original price to sale price to over 103%. ~ The average square foot price of $531 per square foot was up nearly 15%. Living area also increased by nearly 14%.

Somerville Condo Trends – May 2013

Somerville Condo Trends 2013

Somerville Summary: May condo inventory remains at record lows, down 53% from a year ago. ~ Listing market value was down by 48% from 40 million to 21 million in value. ~ The median list price, like in Cambridge was unchanged with the active days on market shrinking 52% to one month. ~ Condos going under agreement slipped by over12% from a year ago.

Somerville Condo Sales Chart 5/13

The number of condos sold in May also slipped by close to 4%, which resulted in a modest 2% gain in year to date sales. ~ Somerville sold condo market value YTD was up 6% to 62 million from 59 million in 2012. ~       The median sales price was up 6%. ~ Days on market decreased to 40 days. Th original price to sale price ratio was 102% of original list price due to competitive bidding. ~ The average square foot price $370 was up 9% per square foot with the living area decreasing less than 10%.

Cambridge Condo Trends – April 2013

Cambridge Condos April 2013Cambridge Summary: Inventory remains a huge challenge for buyers, demand remains high and inventory lower than last year by 38%. ~ Condo market inventory value was down 18% to $77 million vs. 94 million at the end of April last year. ~ The median list price rose 23% with the days on market dropping by 15 days before going off market. ~ Condos that went under agreement for the month are up 33%.~

Cambridge Condo Sales Chart April 2013Cambridge condo sales, month to date, are down 13 % with the year to date up by 14%. Sold market dollar volume YTD went up 25% from 83 million to 103 million in sales. The median sale price rose12%. ~ Multiple offers and quick sales put the original price to sale price over 100%. ~ The average square foot price of $550 per square foot went up 13%.


Somerville Condo Trends – April 2013

somervilleApril2013

Somerville Summary: April condo inventory remains at record lows, down 50% from a year ago. ~ Listing market value was down by 45% from 54 million to 30 million in value. ~ The median list price increased by 15% with the active days on market shrinking 44% or by 25 days. ~ Condos going under agreement went up 31% from a year ago.

Somerville Condo Sales Chart April 2013

The number of condos sold in March was up by 3%, which resulted in a 5.5% decrease in year to date sales. ~ Somerville sold condo market value YTD was up 6% to 39 million from 37 million. ~ The median sales price was up 3%. ~ Days on market increased 53% to just over a month. The original price to sale price ratio was 103% of original list price due to competitive bidding. ~ The average square foot price $370, up 4% per square foot with the living area remaining about the same.

Cambridge Condo Trends – March 2013

Cambridge Condo Trends March 2013It is indeed a seller’s market.  Competing multiple offers have become normal with cash buyers dominating Cambridge real estate sales.  I have never seen anything like it in my 24 years in the business.

Cambridge Summary: Inventory remains much lower than a year ago by -38%, a huge challenge for buyers where demand remains high and inventory low. ~ Condo inventory value is down 30% to $62 million vs. 88 million at the end of March last year. ~ The median list price rose 7% with the days on market dropping 18% or by 14 days before going off market. ~ Condos that went under agreement for the month are up 20%.

Cambridge Condo sales chart 3-13

Cambridge condo sales, month to date, are up by 59% with the year to date up by 30%. Sold market volume is up 107% from 19 million to over 39 million in sales. The median sale price was up 19% to $509,900 ~ Multiple offers and quick sales keepthe original price to sale price close to 100%. ~ The average square foot price for March was $498 per square foot up 3.5% from last year.

Somerville Condo Trends – March 2013

Somerville Condos 3-13Somerville Summary: March condo inventory remains at record lows, down 51% from a year ago. ~ Listing market value was down by 48% from 48 million to over 48 million in listing value. ~ The median list price increased by 7% with the active days on market shrinking 45% or by 29 days. ~ Condos going under agreement were down 6% from a year ago.

somerville condo trends

The number of condos sold in March was down by 30%, which resulted in a 13% decrease in year to date sales. ~

Somerville sold condo market value was up 13% 9 million to 10+ million in sales. ~ The median sales price was up 13% at $492,000. ~ Days on market increased 43%to over a month. The original price to sale price ratio was at 98% of original list price due to competitive bidding. ~ The average square foot price $382, up 8% per square foot with the living area increasing by 211 square feet.

Cambridge Condo Trends – February 2013

Cambridge Condos February 2013
Sold condos divided by condos for sale shows % of market sold for the month. Absorption rate = how long to sell the inventory based on the % sold for that month.

Cambridge Summary: Inventory remains lower than a year ago by 14%,a real challenge for buyers. Demand remains high and inventory low. ~ Condo for sale market value is flat, down 0.2% at $61.5  million in condo listing volume. ~ The median list price rose 6% with the  days on market dropping 32% or by 44 days before going off market. ~ Condos that went under agreement for the month are up 20%.

Cambridge condo sales 2.13

Cambridge condo sales, month to date, are down by 26% whereas the year to date is up by 5%. Sold market value is down 14% to $9,027 million in sales.  The average sale price was up 16% to $531,000 ~ Multiple offers and quick sales put the original price to sale price at 100%. ~ The average square foot price in February was $516 per square foot up 11%  from last year.

Somerville Condo Trends – February 2013

Somerville Condos 2/13
Sold condos divided by condos for sale shows % of market sold for the month. Absorption rate = how long to sell the inventory based on the % sold for that month.

Somerville Summary: February condo inventory is at record lows, down 42% from a year ago. ~ Listing market value was down by 33% to $26,212,000 in value. ~ The median list price increased by 19% with the active days on market shrank 56% or 37 days. ~ Condos going under agreement were down 16% from a year ago.

Somerville Condo sales chart 2/13 2.13


The number of condos sold in February were the same, which resulted in a 13% increase year to date. ~ Somerville sold condo market value went up 31% to $15,312,350. ~ The average sales price was up 29% at $487,855. Days on market improved 37% by 41 days. The original price to sale price ratio was at 99% of original list price due to competitive bidding. ~ The average square foot price was $359, up 7% per square foot with the living area increasing by 66 square feet.

Cambridge Condo Trends

Cambridge Condo Trends Jan. 2013

Cambridge Summary: Inventory is slightly lower than a year ago by 2% and remains a challenge for buyers.  Demand remains high and inventory low. ~ condo Listing $ Volume is up 27% from $ 49 million to over 62 million in total condo listing market value as is the median list price. ~ The days on market dropped 66 days to 71 days before going off market. ~ Condos that went under agreement for the month are up sharply by 88%. Cambridge condo sales, month to date, are also up by 12% as we begin 2013.

Cambridge Condo Sales Chart

Sold $ Volume is starting strong up 49% from $5.6 million in 2012 to $8.4 million in 2013. The median sale price increased by 10%. ~ The average square foot price in January was $508 per square foot up 16% from last year with the average living shrunk by 111 square feet.

Paul’s Condo Trends – January 2013

Somerville Condos

Somerville Summary: January condo inventory is at record lows, down 43% from a year ago. ~ Listing $ Volume was down by 40% from $33 million to nearly $20 million in total market value. ~ The median list price increased by 6% with the active days on market shrinking 30 days to just over 2 months. ~ Condos going under agreement improved by 26% from a year ago.

Somerville Condo Sales Chart

The number of condos sold for January went up by 26%. ~ Somerville condo Sold $ Volume for went up 16% from $15 million in sales to over $17 million. ~ Sold average days on market improved by 48 days and the median sale price  improved by 13%. The original price to sale price ratio jumped by 7% of the original list price due to competitive bidding. ~ The average square foot price was up by $60 per square foot with the average condo living area remaining about the same.