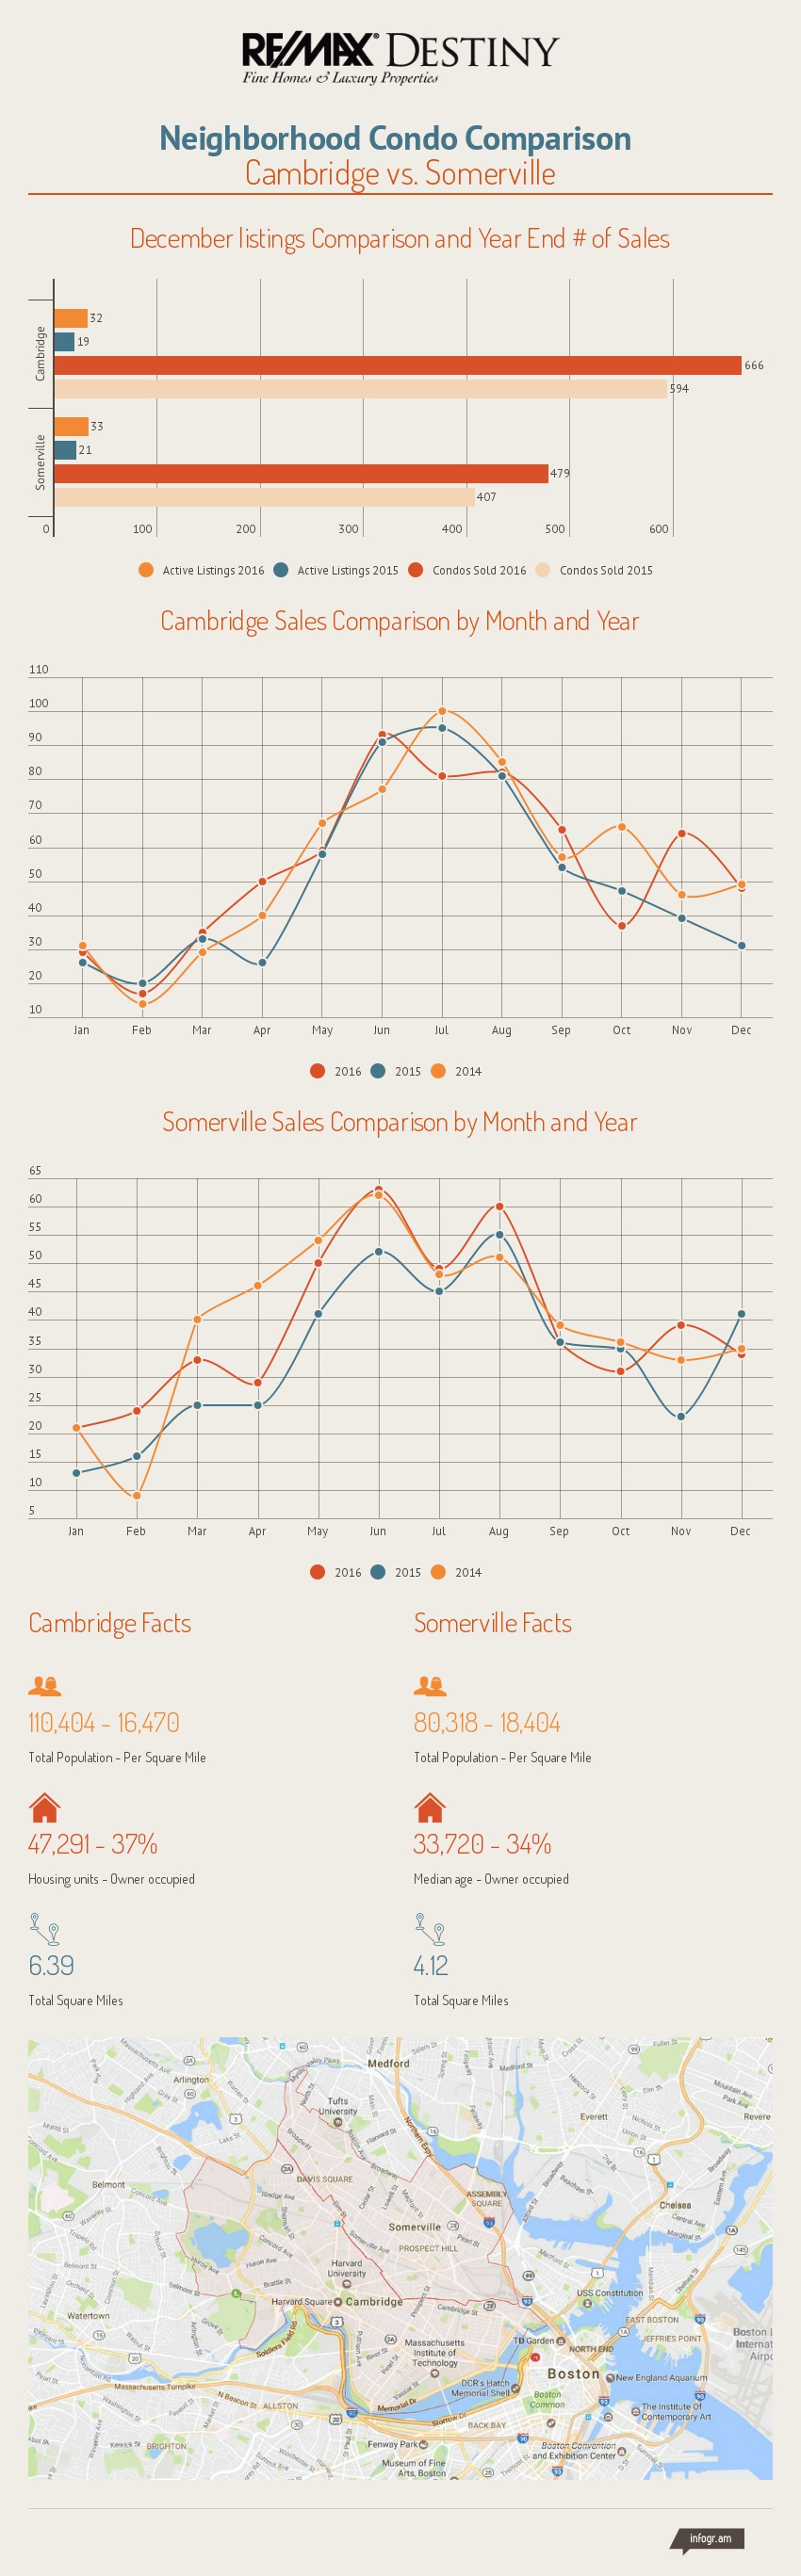
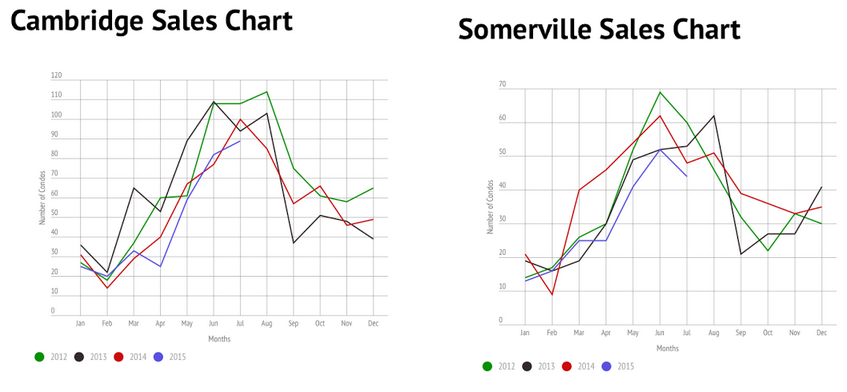
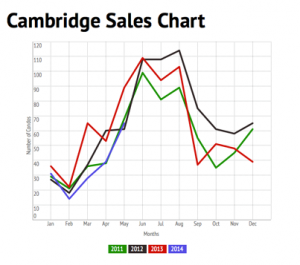
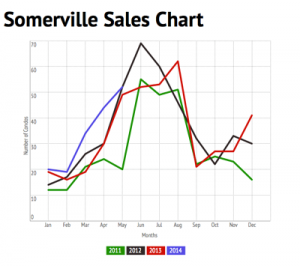
Overall estimates for residential appreciation in the Boston market over the last year is in the range of 11% and Zillow is conservatively predicting around 5% for the next year. Is this growth sustainable? Who knows? What we do know is that the market is cyclical and that what goes up spirals around to a seemingly higher low than the last. Take a look at the graphs below.
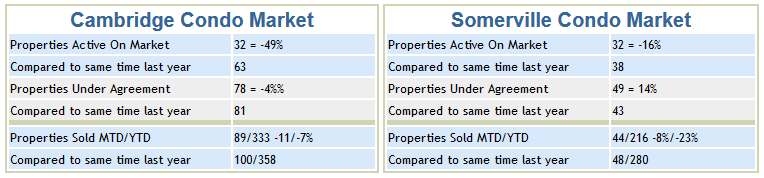
Cambridge / Somerville Condo Market Comparison June 2017 vs. 2016
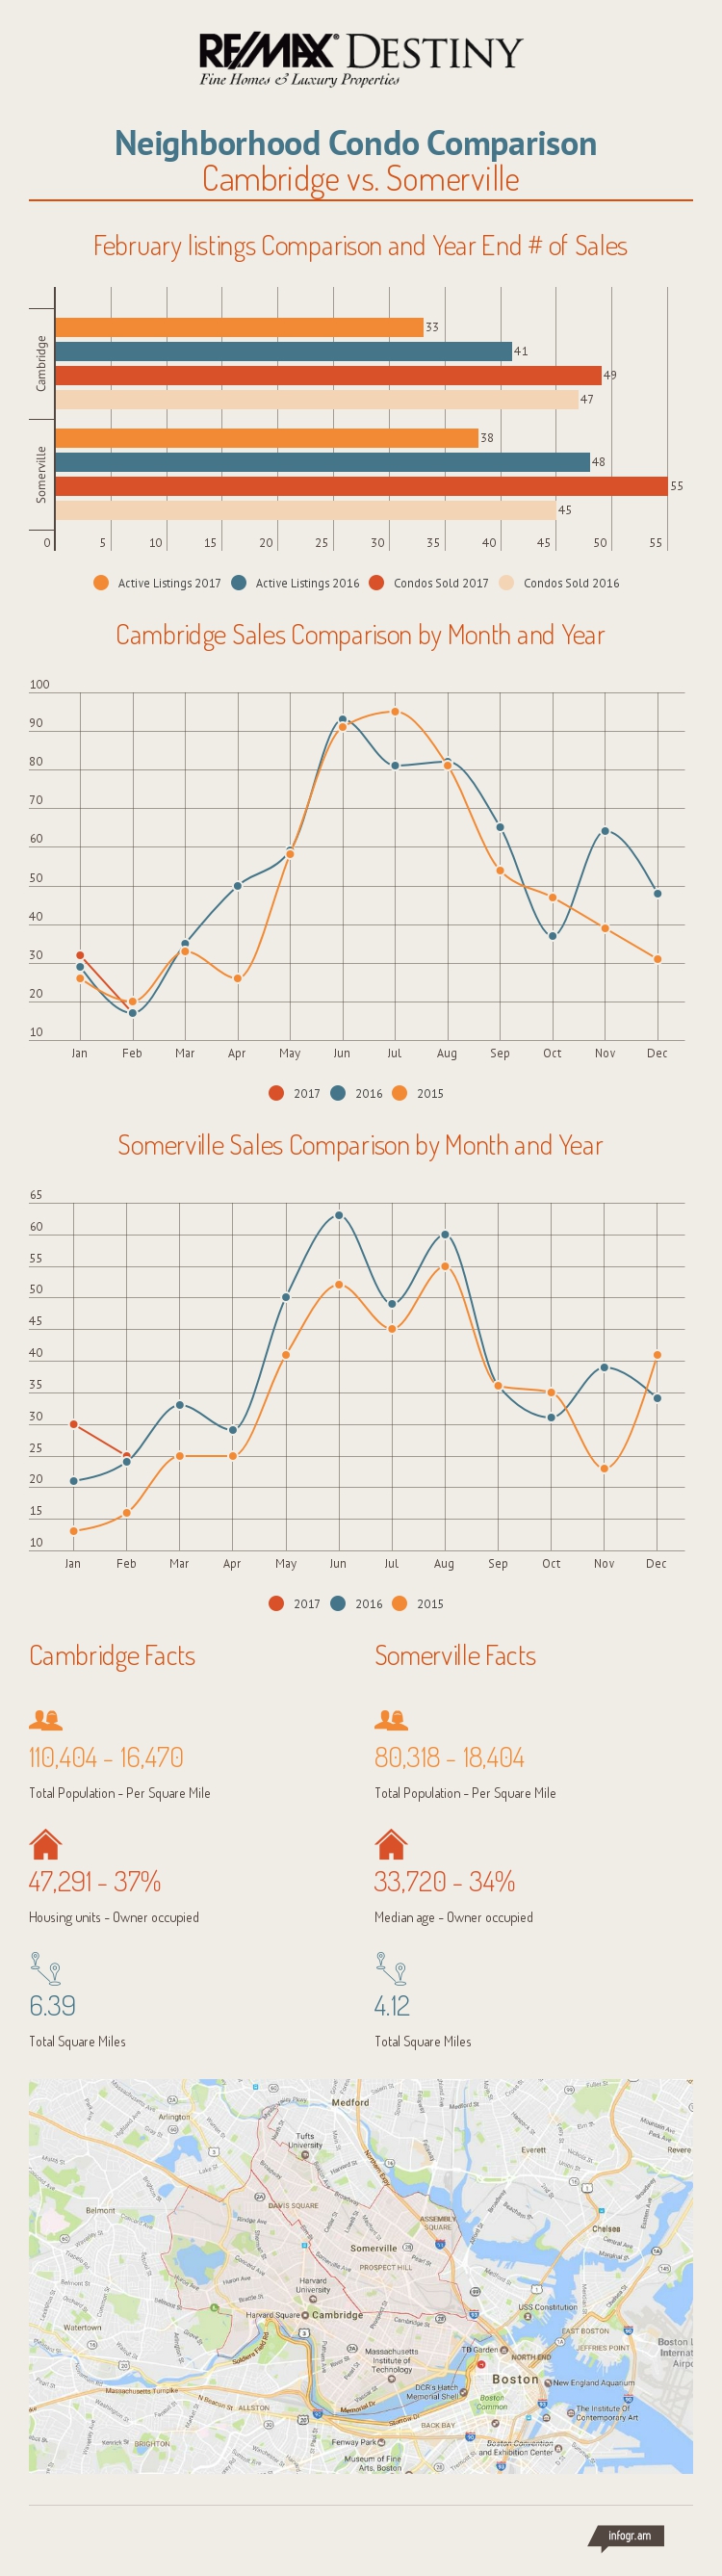
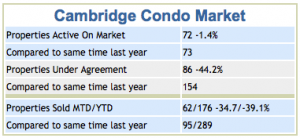
Cambridge:
June 2017: Condos sold: 81 = less14% | Average. SF: $779 = 11% increase
Median Sale Price: $769,000 = up 7% | Sale price to original price: 108%
June 2016: Condos sold: 94 | Avg. SF: $701
Median Sale Price: $716,950 | Sale price to original: 107.4%
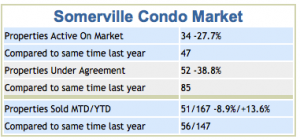
Somerville:
June 2017: Condos sold: 53 = less18% | Avg. SF: $592 = 14% increase
Median Sale Price: $611,000 = up 2% | Sale price to original: 107.4%
June 2016: Condos sold: 65 | Avg. SF: $521
Median Sale Price: $600,000 | Sale price to original: 104.6%

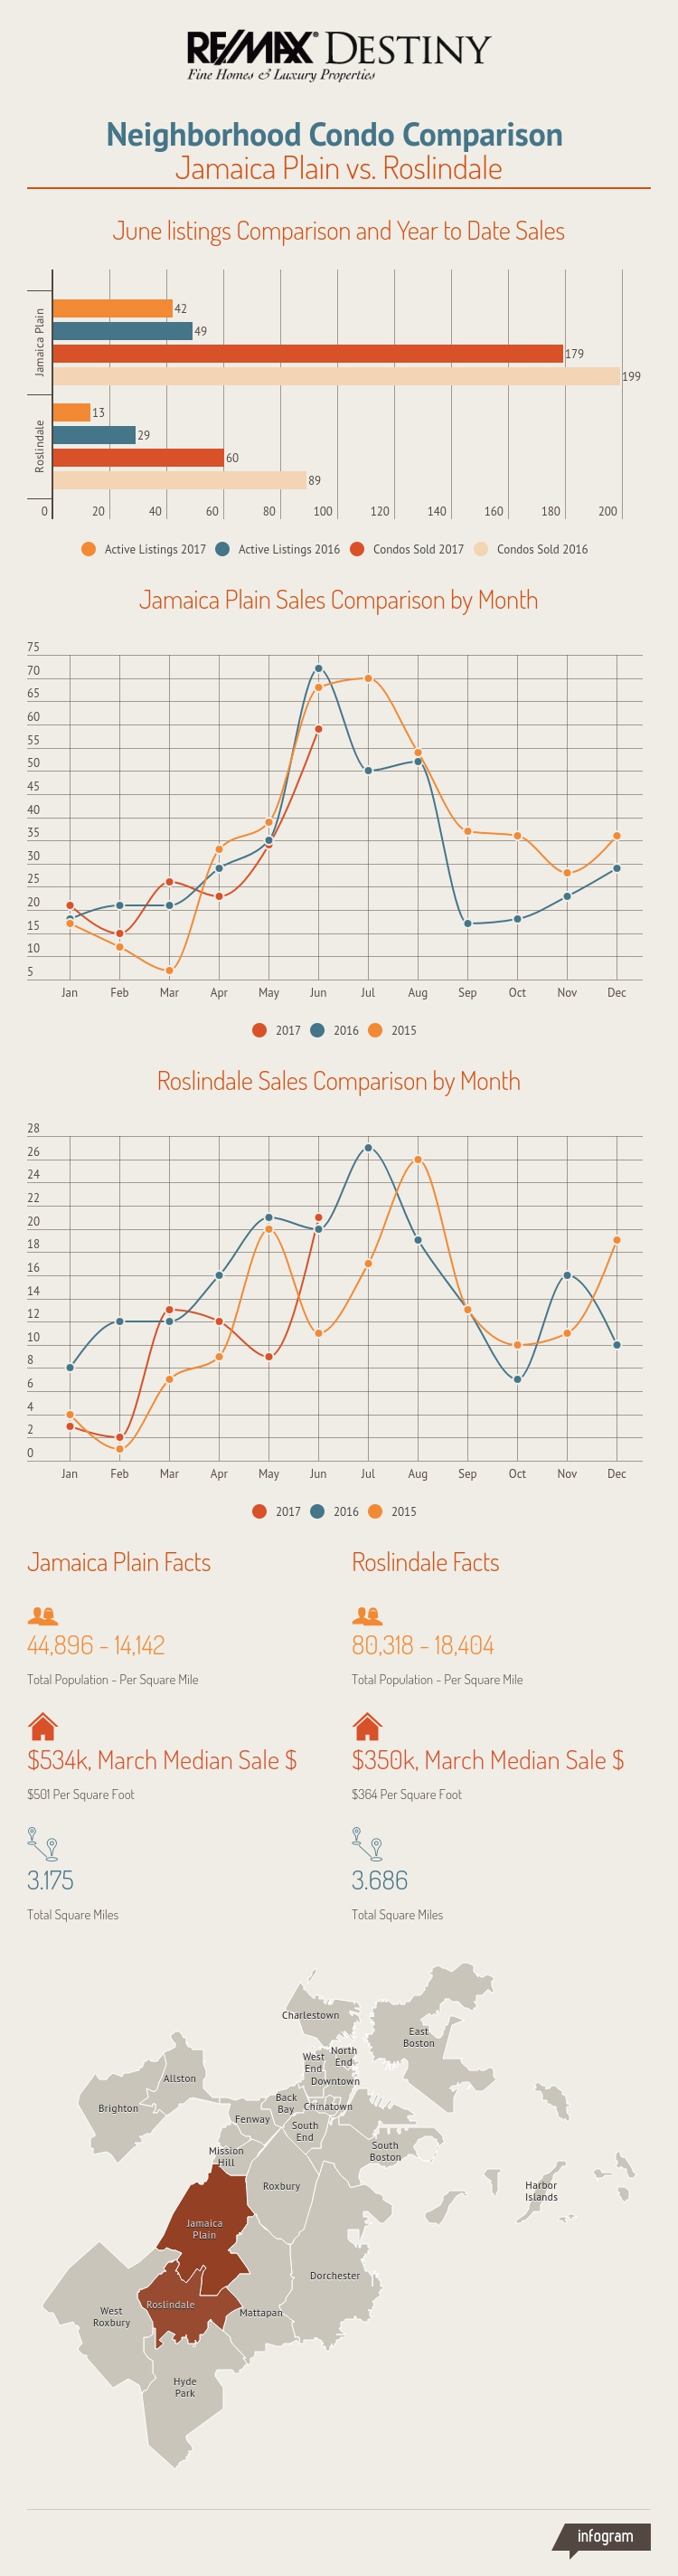
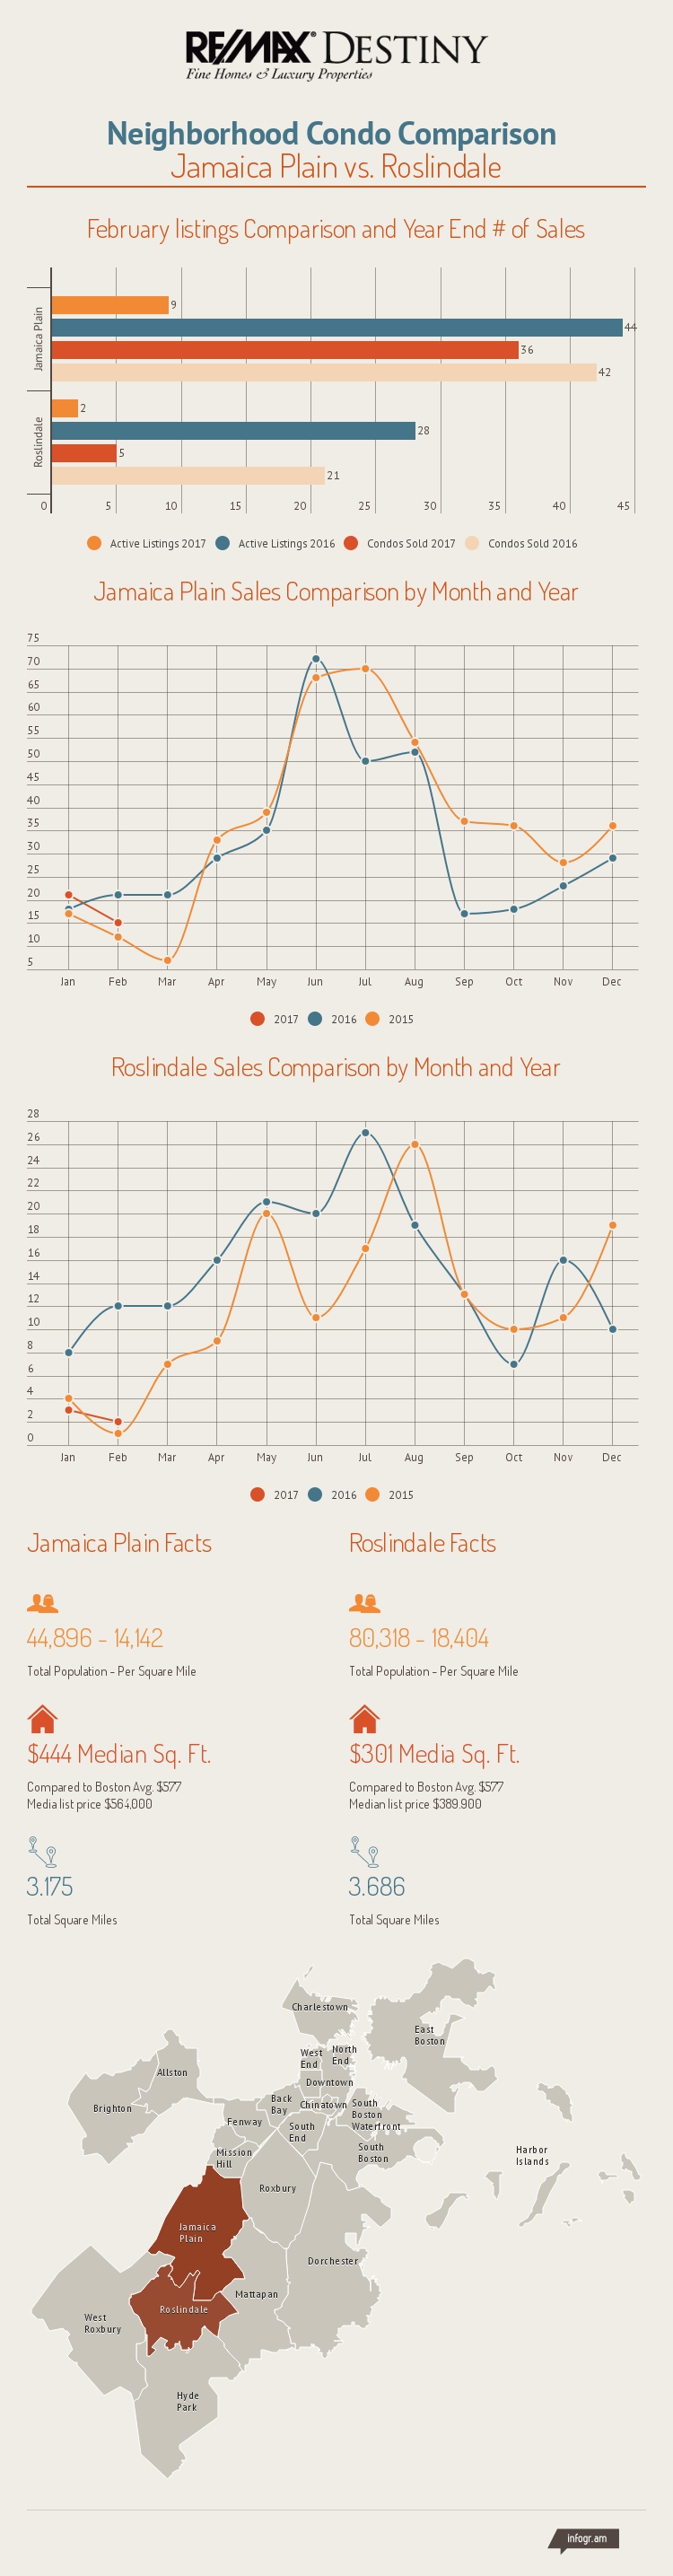
JP/ Roslindale Condo Market Comparison June 2017 vs. 2016
Jamaica Plain:
June 2017: Condos sold: 59 = less 19%| Avg. SF: $503
Median Sale Price: $504,000 = up 3% | Sale price to original: 103.7%
June 2016: Condos sold: 73 | Avg. SF: $463 = 9% increase
Median Sale Price: $490,000 | Sale price to 0riginal: 106.1%
Roslindale:
June 2017: Condos sold: 21 = 5% increase | Avg. SF: $360 = 5% decrease
Median Sale Price: $455,000 = up 23% | Sale price to original: 105.7%
June 2016: Condos sold: 20 | Avg. SF: $378
Median Sale Price: $368,000 | Sale price to original: 103.3%