Somerville Year End Condo Trends 2012

somerville condo trends 2012

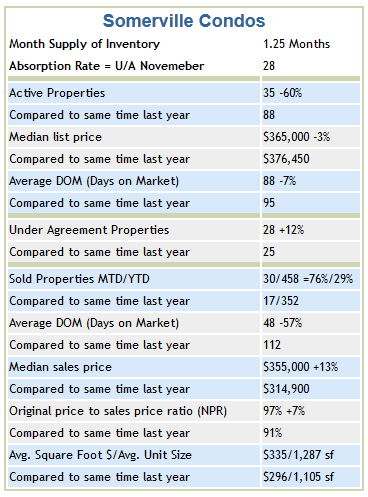
Somerville Summary: December condo inventory remained at record lows, down 60% from a year ago. ~ Listing $ Volume mirrored this, down 58% from $35 million to $14 million in total market value. ~ The median list price decreased by a modest 3% with the active days on market less than 2 months. ~ Condos going under agreement improved by 12% from a year a

Somerville Condo Trends December 2012


Condos sold for the month were up big by 76% with year end sales up 29%. ~ Somerville Condo Sold $ Volume for 2012 went up 33% from year end last year. ~ Sold average days on market remained less than 2 months and the median sale price improved by 13%. The original price to sale price ratio remained high at 97% of the original list price due to competitive bidding. ~ The average square foot price was $335 per square foot with the average condo living area at 1,183 square feet.


Cambridge Condo Trends for November

Cambridge Summary: Lack of inventory remains low down 28% compared to November last year. ~ Condo listing $ volume remained down by 15% from $71 million to 60 million in market value. ~ The median list price is up by 21% with days on market improving 4 to 3 months before going off market. ~ Condos that went under agreement for the month slipped by 6%.

Cambridge condo sales, month to date, are up 20% with year to date number of sold condos increasing by 17%. Sold $ volume YTD increased by 19% from $324 million in 2011 to $386 million in 2012. The median sale price increased by 16% with the ratio of sale price to original price at 99% due to multiple offer bidding and reduced time on market. ~ The average square foot price for November rose to $503 per square foot with the average living area at 1,093 square feet.

Somerville Condo Trends for November

Somerville Summary: November condo inventory remains at record lows, less 46% from a year ago.. ~ Listing $ volume mirrored this down 47% from $47 million to $25 million in value. ~ The median list price decreased by a modest 4% with the active days on market around 2 months. ~ Condos going under agreement improved by 13% from a year ago.

Condos sold for the month were up a solid 43% with the year to date sales up 27%. ~ Somerville condo sold $ volume YTD is up 30% from the end of November last year. ~ Sold average days on market was less than 2 months and the median price slid by 10%. The original price to sale price ratio remained high at 97% of the original list price due to competitive bidding. ~ The average square foot price was $335 per square foot with the average condo living area at 1,183 square feet.

Somerville Condo Trends – October 2012

Somerville Summary: September condo inventory remains at record lows, down 51% from a year ago. ~ Listing $ volume down 55% from $55 million to $25 million in value. ~ The median list price decreased by a modest 5% with the active days on market dropping 30 days to under 2 months. ~ Condos going under agreement improved by 58%.


Condos sold for the month were down 11% with the year to date sales up 25%. ~ Somerville condo sold $ volume YTD is up 32% from the end of October last year. ~ Sold average days on market was less than 2 months and the median price slid by 4%. The original price to sale price ratio remained at 98% of the original list price due to competitive bidding. ~ The average square foot price was $356 per square foot with the average condo living area at 1,048 square feet.

Cambridge Condo Trends – April 2012

Cambridge Summary: Inventory continues to remain quite low, up  from – 46% from last month to -42% compared to April last year. ~ Condo listing $ volume remains low by 39% from 161 million to 97 million in market value. ~ The median list price is up by 2.4% or 11K with days on market dropping from 3 monyhs to 2 months on average before going off market. ~ Condos that went under agreement were pretty much the same.

Cambridge condo sales month to date are up by 26% with year to date number sold condos up by 15%. Sold $ volume YTD improved 14% from 70 million in 2011 to 82 million this year. The median sale price improved by 3.6% with the ratio of sale price to original price above at 100% due to multiple bidding and reduced time on market. ~ The average square foot price for April was $484 per square foot with the average living areaof 1,185 square feet.

Somerville Condo Trends – April 2012

Somerville Summary: April condo inventory remained down by -24%. ~ Listing $ volume was down 15 million from $54.6 million to $69.7million. ~ The median list price went up 7.5% with the active days on market sliding below 2 months. ~ Condos going under agreement increased by 36%. Condos sold for the month exceeded last April by 10% with the year to date sales up 16%. ~

Somerville condo sold $ volume YTD is up 21.9% from the end of April last year. ~ Sold average days on market dropped by over 3 weeks to 85 days. The original price to sale price ratio increased to 96% of the original list price. ~ The average square foot price increased by $37 to $357 per square foot with the average condo size at 1,294 square feet.


Cambridge Condo Trends – January 2012

Cambridge Summary: We are off to a rough start with Inventory for January remain quite low, less 48% compared to the same period last year. ~ Condo listing $ volume is down 42% from 84 million to 48.5 million in value. Very little improvement from December. ~ The median list price rose by 9%with properties selling at about the same rate, taking an average of 4.5 months to either go U/A or off market. ~ The number of condos that went under agreement was down by 15. Cambridge condo sales dropped 13%.


Sold $ volume was down 32% from 17 to 12 million. ~ The median sale price dropped 8% with the ratio of sale price to original price reflecting the limited inventory at 97%. ~ The average square foot price for January was $433 per square foot with the average living area at 1,045 sf compared to $501 per square foot with an average unit size of 1,088 square feet in 2011.